Employee Turnover Statistics: What the Data Tells Us
In the fast-changing job market of India, employee turnover is a big worry for companies big and small. Knowing the latest stats on employee turnover is key for companies wanting to keep their best workers. But what do these numbers mean, and how can companies use this info to get better at keeping employees? Let’s explore the insights that could change how you handle keeping your team.
Thank you for reading this post, don't forget to subscribe!Key Takeaways
- India’s workforce experiences an average annual turnover rate of 18%.
- Voluntary turnover accounts for 13% of employee departures, while involuntary turnover stands at 6%.
- The median tenure for workers in India is 4.1 years, with management and professional roles averaging 4.9 years.
- Replacing an employee can cost up to two times their annual salary, posing a significant financial burden.
- Burnout, lack of growth opportunities, and salary dissatisfaction are leading drivers of employee turnover in India.
The State of Employee Turnover
In today’s workforce, employee turnover is a big worry for companies in India. The Bureau of Labor Statistics says the average annual separation rate was 3.6% in 2023. This is a bit less than the 3.9% in the year before. But, voluntary turnover, where employees choose to leave, makes up most of these separations. This shows big issues with keeping employees happy and engaged.
General Turnover Trends
The US job market has seen ups and downs, with job openings hitting highs in 2022 and then dropping a bit. This has affected turnover and the rate at which people leave their jobs. It now takes about 44 days to find a new employee, showing the effort and cost to replace one.
Industry-Specific Turnover Rates
Turnover rates differ a lot between industries. The tech sector had a high rate of 13.2% in 2022. This could be due to the high demand for skills, job hopping, and layoffs. Retail and consumer products also see a lot of turnover, averaging about 13%.
The healthcare and social assistance sector faced a 22.7% turnover rate in 2022. This was due to burnout and staffing issues during the pandemic. Other high-turnover industries include construction, manufacturing, and fast food. Yet, some companies like United Airlines and Meta have kept turnover rates lower, showing it’s possible to keep employees.
“Replacing an employee who quits typically costs between 33% to 50% of their salary immediately, with total turnover costs ranging from 90% to 200% of that salary.”
The cost of losing employees is high, affecting both money and productivity. This makes it crucial for companies to focus on keeping their teams stable and happy. By understanding why employees leave and how to keep them, businesses can grow and succeed over time.
Employee Turnover Statistics
Employee turnover statistics are key to understanding how to keep talent. By looking at who leaves and why, companies can improve keeping workers and moving people around. This helps make the workforce more stable and flexible.
The average worker in the U.S. leaves their job after about 1.5 years, with 25% leaving by choice and 29% by being let go. This shows how important it is for companies to keep their workers happy and engaged.
| Industry | Turnover Rate |
|---|---|
| Entertainment and Hospitality | 63.5% – 79.5% |
| Government | 18.6% |
| Healthcare | 14.2% |
| Insurance | 8.8% |
| Utilities | 6.1% |
Looking at turnover rates by industry shows how important it is to compare with others in your field. A high rate might mean there are problems to fix. A low rate means your company is doing something right to keep workers.
Also, a lot of new hires leave within six months, showing the need for better support early on. By watching how people move around and stay in jobs, companies can make plans to keep more workers.
“Turnover costs are reported to be 33% of a worker’s annual salary, making it a significant financial burden for organizations.”
In summary, looking at employee turnover helps companies understand their workers better. By using data, they can make plans to attract and keep top talent. Knowing why people leave helps businesses manage their teams better, leading to a happier and more productive workforce.
The Cost of Employee Turnover
Financial Impact
Employee turnover can significantly affect a company’s finances. Replacing an employee can cost between 33% to 50% of their yearly salary. Sometimes, the total cost can go up to 90% to 200% of the salary. This includes costs like recruitment, onboarding, lost productivity, and the effect on team morale.
Lower employee turnover is linked to higher business profits, happier employees, and better productivity. On the other hand, high turnover often leads to more product failures. This shows why keeping employees is crucial.
| Turnover Cost Metric | Estimated Range |
|---|---|
| Cost to replace an employee | 0.5 to 2 times the employee’s annual salary |
| Cost to replace | Up to 213% of the employee’s yearly salary |
| Indirect costs (productivity, morale) | Two-thirds of the total turnover cost |
| Annual cost of lost productivity | $1.8 trillion for U.S. businesses |
| Annual turnover cost for U.S. businesses | $1 trillion |
The financial effects of employee turnover are clear. Companies spend six to nine months of an employee’s salary to find and train a new one. The average cost of turnover for most jobs is 21% of an employee’s salary.
Indirect costs, like lost productivity and low morale, make up two-thirds of the total cost. Job vacancies can lead to more work not being done, disengaged workers, and delays. It can take one to two years for a new employee to match the productivity of a high-performing one, causing revenue loss.
Employee turnover has cost U.S. industries over $630 billion. The annual cost to U.S. businesses is about $1 trillion. The talent shortage is expected to cost the US $435.7 billion, the UK $90 billion, and China $147.1 billion. The real cost of turnover, including management time, customer impact, and morale, could be at least $170,000 per year.
Key Drivers of Employee Turnover
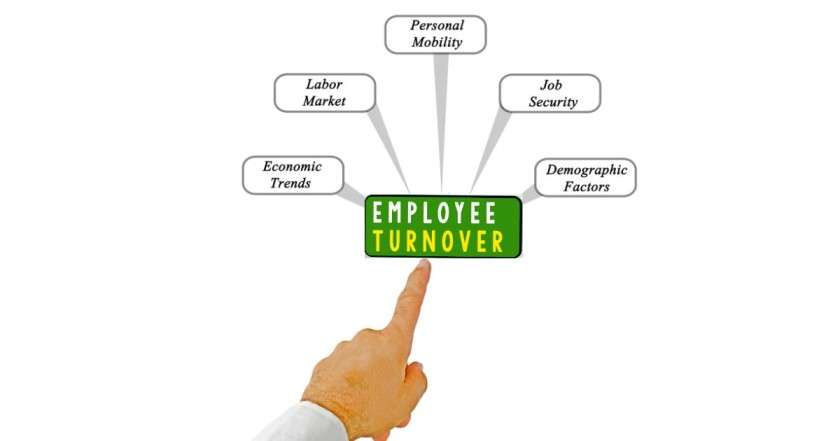
Knowing what makes employees leave is key to keeping them. Studies show many things affect why people quit, like their background, the job itself, and how the company works.
Demographic Factors
Being married and having family duties can change someone’s mind about leaving a job. People with families and older workers tend to stay longer. They don’t like the risks of job changes.
Younger workers often leave jobs more than older, more experienced ones.
Job-related Factors
What someone does at work affects if they’ll stay or go. Doing the same thing every day can make people want to leave. But, having chances to grow, advance in their career, and find their work challenging can make them happier and more likely to stay.
How stressful a job is, how clear their role is, and what they do can also affect their choice to leave.
Organizational Factors
Having other job options, being happy with pay and benefits, and liking the company culture can make people leave. If a job offers better chances than other places, or if they’re happy with what they earn and the company’s values, they’re less likely to leave.
To keep good employees, understanding what makes them leave is key. This helps make plans to keep them happy and with the company.
“Keeping top talent is very important. Knowing why people leave helps make a stable and happy workforce.”
Conclusion
Employee turnover is a big problem for companies in India. The data shows high costs and trends linked to losing employees. By looking into the reasons behind this, companies can make plans to keep employees and build a stable team.
Improving company culture and how managers work can help. So can making the hiring and onboarding process better. These steps can help reduce turnover and its bad effects. By focusing on keeping employees happy and loyal, companies can do better in finding and keeping good talent.
The numbers on employee turnover are clear. They show the need to tackle this issue. By using data to understand why people leave, companies can make smart moves to keep employees. This leads to a better work environment for everyone.
FAQ
What is the overall employee turnover rate in India?
The Bureau of Labor Statistics reports that India’s average annual separation rate was 3.6% in 2023. This is a slight drop from the 3.9% in 2022. About two-thirds of these separations were voluntary, meaning employees chose to leave.
How do employee turnover rates vary across different industries?
Turnover rates differ widely across industries. The tech sector saw a high rate of 13.2% in 2022. This is due to high demand for skills, frequent job changes, and layoffs.
Retail and consumer products also have a high turnover rate, around 13%. The healthcare and social assistance sector faced a 22.7% turnover in 2022. This was due to burnout and staffing issues during the pandemic.
What is the financial impact of employee turnover?
Turnover can heavily affect a company’s finances. Replacing an employee can cost 33% to 50% of their salary. Total costs, including recruitment, onboarding, and lost productivity, can be 90% to 200% of the salary.
What are the key drivers of employee turnover?
Several factors lead to employee leaving, including company culture and management. Compensation, work-life balance, and career growth opportunities also play a role.
 hroptimum


